Creating Interactive Visualizations with Plotly’s Dash Framework
1. What is DASH?
Dash is a Python framework developed for building web applications. However, it is more suitable for data visualization applications. Dash was developed based on Flask, Plotly.js, ve React.js libraries. Interactive tables, graphs and data visualizations can be easily developed with Dash without knowing javascript.
With Python, people who perform data analysis, data preparation, data visualization, modeling, device control and reporting can easily develop analytical web applications with dash
You can also make your graphics and tables stunning by taking advantage of the power of CSS and Html in the dash.
2. Installations
Before installing Dash, python3 must be installed on our computer. For this we can install Anaconda on our computer at https://www.anaconda.com/ . After installing Anaconda, we will create a virtual environment for Dash applications on our computer and install the following packages into it.
conda create --name dash # anacondada virtual ortam oluşturmak
conda activate dash veya source active dash #windows veya linuxte virtual ortamı aktive etmek
You can use the following commands related to Dash. Or if you just say pip install dash, you will have installed all of the following packages.
pip install Flask
pip install dash
pip install plotly
pip install dash_html_components # dash html components
pip install dash_core_components # dash core components
pip install dash-table # data table components
By typing pip freeze, we can install the python packages into the virtual environment.
3. Introducing DASH
Dash html components and dash core components are used to create interactive tables and graphs in Dash. In the code below, you can understand what the component created with dash actually refers to as html.
import dash_html_components as html
# Dash html code in python
html.Div([
    html.H1('First Application'),
    html.Div([
        html.P("Dash converts Python classes to HTML elements."),
        html.P("Javascript is used at frontend.")
    ])
])
 # HTML version of the above python code to be displayed in the web browser
  <div>
    <h1>First Dash App</h1>
    <div>
        <p>Dash converts Python classes into HTML</p>
        <p>This conversion happens behind the scenes by Dash's JavaScript front-end</p>
    </div>
</div>
Dash applications basically consist of 2 parts. Layout and Callbacks. With Layout, we define how the Dash application will look and how the application works interactively with Callbacks.
4. Layout and First Application
Python classes have been defined to create visual components of the application in Dash. These components are defined in dash_core_components and dash_html_components packages and we can use them by including them in our project.
Dash Core Components consist of various components to prepare interactive dashboards. In short these are;
- Graphs: to create graphs
- Tabs: to create tabs
- Dropdown: to create dropdpwn
- Sliders: to create slider
- DatePickers: to select date or date range
- Table: to show tables
- Markdown: Used as markdown.
- Checklist: for Checklist
- RadioItems: for Radio button
- Location: for location bar
- Store: to save data in Browser.
import dash
import dash_core_components as dcc
import dash_html_components as html
from dash.dependencies import Input, Output
import dash_table
external_stylesheets = [''] #external css file path can be defined.
app = dash.Dash(__name__, external_stylesheets=external_stylesheets)
app.layout = html.Div(children=[
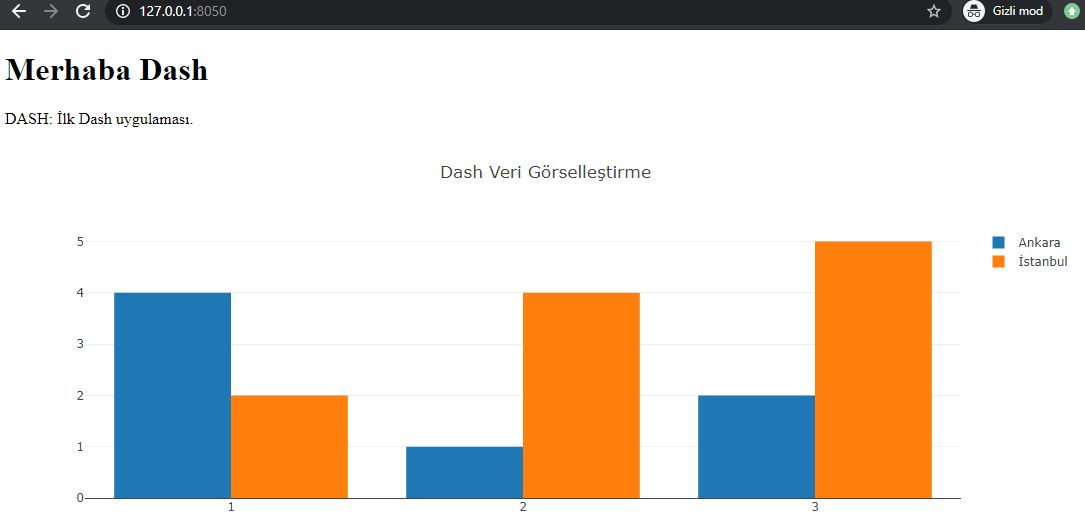
html.H1(children='Hello Dash'),
html.Div(children='''
DASH: First DASH Application.
'''),
dcc.Graph(
id='example-graph',
figure={
'data': [
{'x': [1, 2, 3], 'y': [4, 1, 2], 'type': 'bar', 'name': 'Newyork'},
{'x': [1, 2, 3], 'y': [2, 4, 5], 'type': 'bar', 'name':'London'},
],
'layout': {
'title': 'Dash Data Visualisation'
}
}
)
])
if __name__ == '__main__':
app.run_server(debug=True)
First, we created DASH object with “app = dash.Dash (__ name__)“. Then we defined how the layout will be with app.layout in the application.
We defined the graphic in our application with dcc.Graph () in layout. We entered information about the data and the type of the chart into the chart.
In the end, we are launching our application with app.run_serv (debug = True). When we run the application, we get the following output in the web browser.
5. DASH Callbacks
In Dash application, we use the @ app.callback () decorator above function to make our graphics interactive.
Let’s examine the simplest callback application below. First, we define the dash core element from which we will get input in our layout. This is the equivalent of the form element in html. The value of this input element is reached in the callback decorator with the element’s id = ‘my-id’ value and we use it in the function. Then, in the layout where this value will be used and where we will render it as output, we reach the element in the layout with id = ‘my-div’ in the decorator and we can return either a graphic or an output element according to the feature of the function.
import dash
import dash_core_components as dcc
import dash_html_components as html
from dash.dependencies import Input, Output
app = dash.Dash(__name__)
app.layout = html.Div([
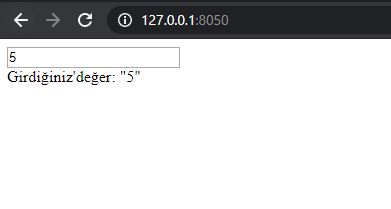
dcc.Input(id='my-id', value='initial value', type='text'),
html.Div(id='my-div')
])
@app.callback(
Output(component_id='my-div', component_property='children'),
[Input(component_id='my-id', component_property='value')]
)
def update_output_div(input_value):
return 'Girdiğiniz değer: "{}"'.format(input_value)
if __name__ == '__main__':
app.run_server(debug=True)
We made our layout interactive with the app.callback () decorator that we write the update_output_div () above function. Since we entered 5, we get 5 as output.
Let’s look at a more advanced callback application.
import dash
import dash_core_components as dcc
import dash_html_components as html
from dash.dependencies import Input, Output
import pandas as pd

df = pd.read_csv('https://raw.githubusercontent.com/plotly/datasets/master/gapminderDataFiveYear.csv')

external_stylesheets = ['https://codepen.io/chriddyp/pen/bWLwgP.css']

app = dash.Dash(__name__, external_stylesheets=external_stylesheets)

app.layout = html.Div([
    dcc.Graph(id='graph-with-slider'),
    dcc.Slider(
        id='year-slider',
        min=df['year'].min(),
        max=df['year'].max(),
        value=df['year'].min(),
        marks={str(year): str(year) for year in df['year'].unique()},
        step=None
    )
])

@app.callback(
    Output('graph-with-slider', 'figure'),
    [Input('year-slider', 'value')])
def update_figure(selected_year):
    filtered_df = df[df.year == selected_year]
    traces = []
    for i in filtered_df.continent.unique():
        df_by_continent = filtered_df[filtered_df['continent'] == i]
        traces.append(dict(
            x=df_by_continent['gdpPercap'],
            y=df_by_continent['lifeExp'],
            text=df_by_continent['country'],
            mode='markers',
            opacity=0.7,
            marker={
                'size': 15,
                'line': {'width': 0.5, 'color': 'white'}
            },
            name=i
        ))

    return {
        'data': traces,
        'layout': dict(
            xaxis={'type': 'log', 'title': 'GDP Per Capita',
                   'range':[2.3, 4.8]},
            yaxis={'title': 'Life Expectancy', 'range': [20, 90]},
            margin={'l': 40, 'b': 40, 't': 10, 'r': 10},
            legend={'x': 0, 'y': 1},
            hovermode='closest',
            transition = {'duration': 500},
        )
    }


if __name__ == '__main__':
    app.run_server(debug=True)
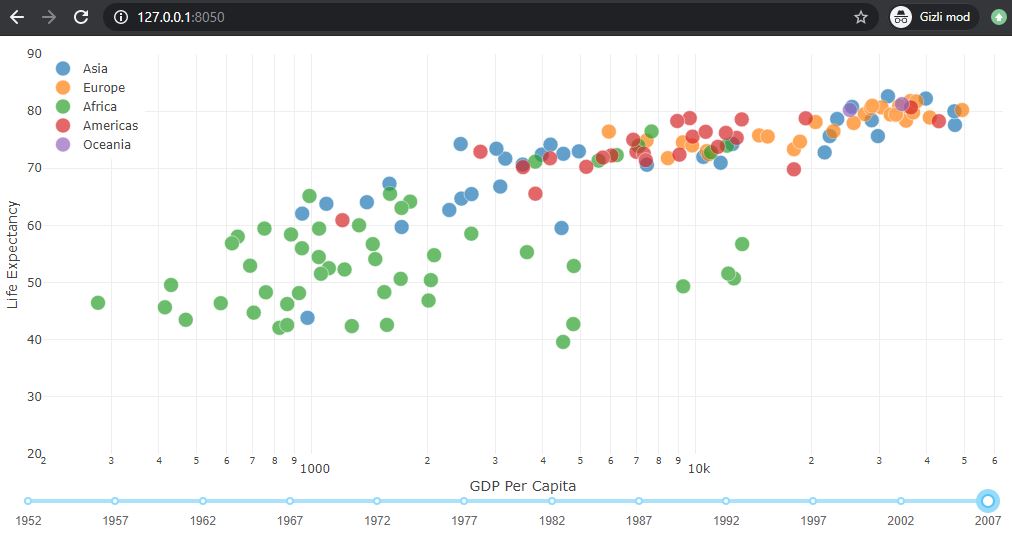
We made graph interactive by adding a slider to our chart. We determine where the graph will be rendered by defining it with dcc.Graph (id = ‘graph-with-slider’) in the layout. Note that the Input is defined in square brackets.
The output of the application
6. DASH DATATABLE
Dash datatable is a component created for seeing the data together in the tables, providing sorting and interactivity. Below is the simplest dash datatable created with Dash.
import dash
import dash_table
import pandas as pd

df = pd.read_csv('https://raw.githubusercontent.com/plotly/datasets/master/solar.csv')

app = dash.Dash(__name__)

app.layout = dash_table.DataTable(
    id='table',
    columns=[{"name": i, "id": i} for i in df.columns],
    data=df.to_dict('records'),
)

if __name__ == '__main__':
    app.run_server(debug=True)
We can see the table below as output.
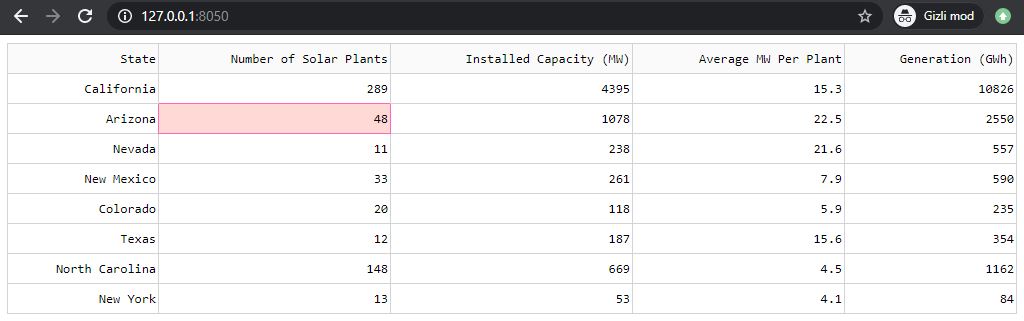
We can add a lot of features to this table by utilizing the documentation of DASH.
SOURCES
- https://medium.com/plotly/introducing-dash-5ecf7191b503
- https://medium.com/analytics-vidhya/building-a-dashboard-app-using-plotlys-dash-a-complete-guide-from-beginner-to-pro-61e890bdc423
- https://dash.plotly.com/
- https://hackersandslackers.com/plotly-dash-with-flask/
- https://medium.com/swlh/dashboards-in-python-for-beginners-and-everyone-else-using-dash-f0a045a86644
- https://levelup.gitconnected.com/dashboards-in-python-for-beginners-using-dash-live-updates-and-streaming-data-into-a-dashboard-37660c1ba661
- https://towardsdatascience.com/how-to-build-a-complex-reporting-dashboard-using-dash-and-plotl-4f4257c18a7f