How to Integrate and Use Xdebug with Visual Studio Code Editor on Docker at PHP Projects
When we develop software projects, most of our time is spent finding bugs. We usually use functions like var_dump(), echo, print_r() to find errors in PHP. Instead, we can run the step-by-step code in the code editor as in other languages such as JAVA, C#, and examine what values are in the variables and catch where the error is more quickly.
In this post, I will explain how to integrate and use the PHP extension xdebug in Visual Studio Code, Docker and PHP .
Although I used Docker in this post, you can install xdebug within the projects you keep in WAMP or XAMPP by following similar steps.
Used Tools and Versions
- PHP 8
- Xdebug 3
- Docker file 3.8
- Laravel 8
- Visual Studio Code
- MAC Computer
Installing XDebug 3 Extension in PHP
First the Xdebug 3 PHP extension needs to be installed on the linux machine where we are running our project. For this, we add the following lines to Dockerfile.
# install and enable xdebug
RUN pecl install xdebug \
    && docker-php-ext-enable xdebug
COPY compose/api_php/xdebug.ini /usr/local/etc/php/conf.d/docker-php-ext-xdebug.ini
Our Laravel project is inside the api folder. We create the xdebug.ini file. As seen in the file above, we define the path of this file in Dockerfile. The file structure is as follows.
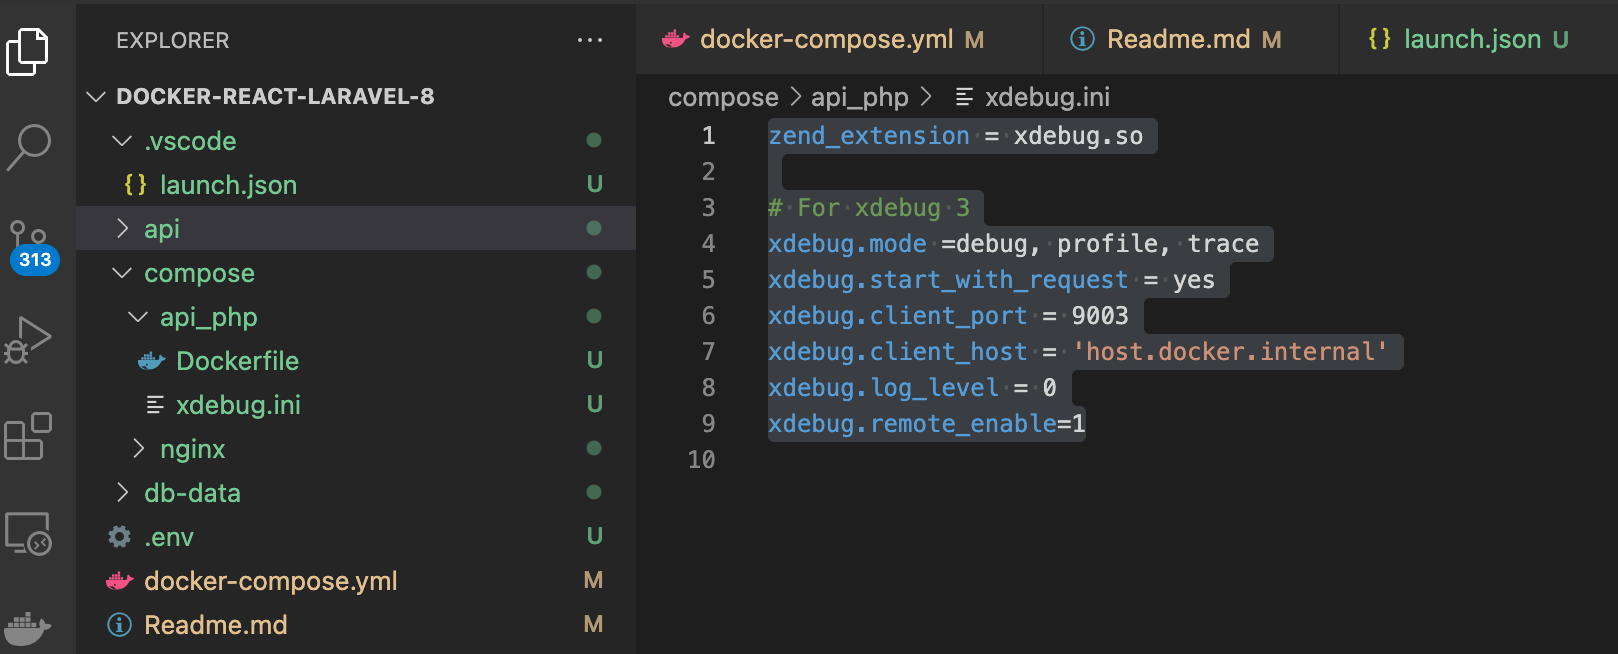
zend_extension = xdebug.so
# For xdebug 3
xdebug.mode =debug, profile, trace
xdebug.start_with_request = yes
xdebug.client_port = 9003
xdebug.client_host = 'host.docker.internal'
xdebug.log_level = 0
xdebug.remote_enable=1
For our Laravel project, we define our api service in the yaml file as follows. Then we build our Docker image and launch our project.
# PHP Service For Laravel Application
api:
build:
context: .
dockerfile: ./compose/api_php/Dockerfile
container_name: api_laravel
stdin_open: true
tty: true
depends_on:
- mariadb
- redis
volumes:
- ./api:/var/www/html
ports:
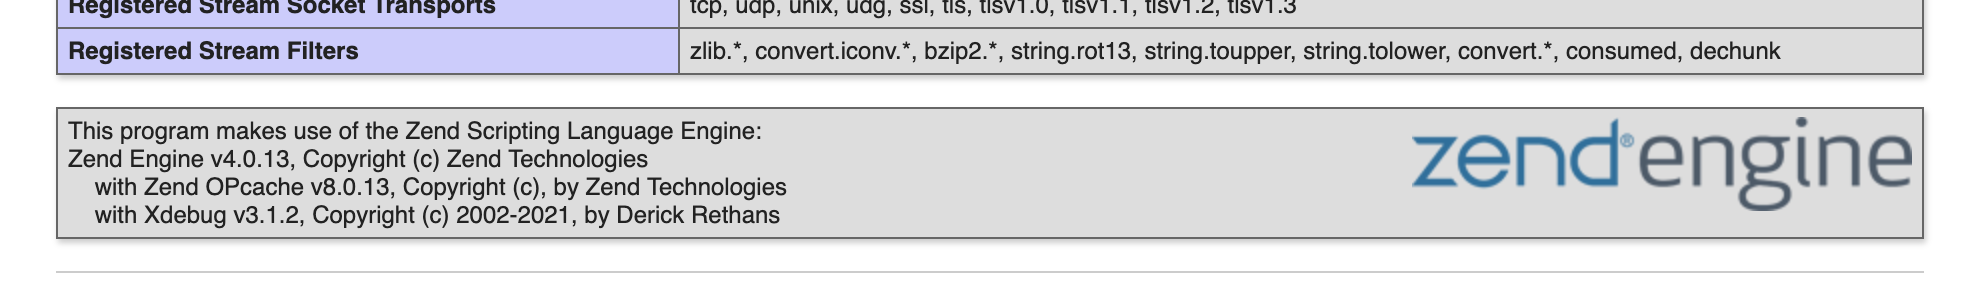
- "9000:9000"We run the <?php phpinfo(); ?> function in our project to see if the xdebug 3 extension is installed correctly. On the screen that appears, we need to see the Xdebug v3.1.2 part as follows.
Visual Studio Code Installations for Xdebug 3
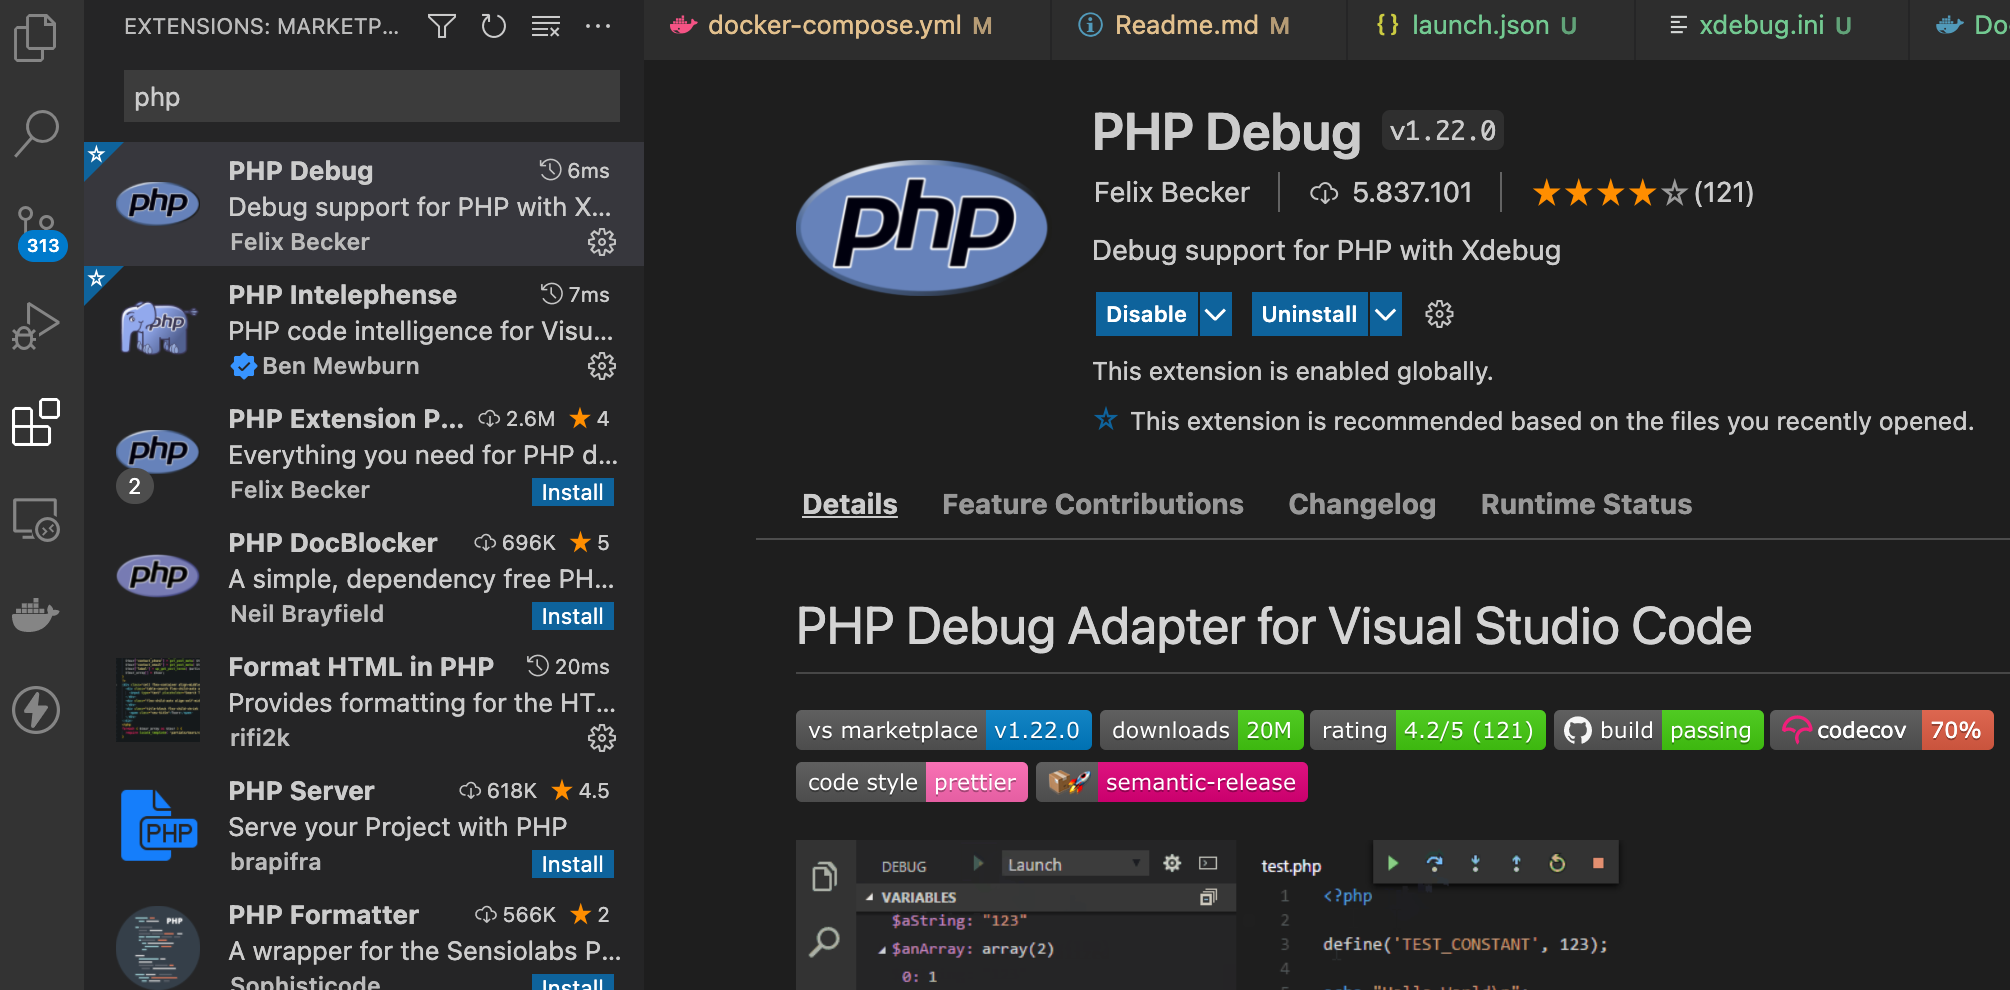
First, we install the PHP Debug extension in the Visual Studio Code editor.
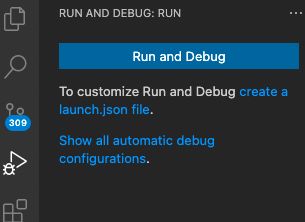
After installing the extension and opening our project with the VSC code editor, we click on the debug button on the left. If there is no launch.json file, the following screen appears. By pressing the Run and Debug button, we create the launch.json file.
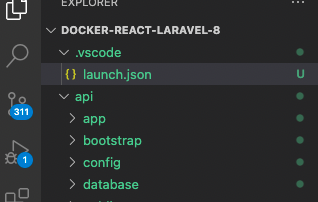
You will see the launch.json file inside the .vscode folder as seen in the picture below.
We edit the launch.json file as follows. The left side of the values in the “pathMappings” key is the directory where our laravel project will stand on the server side that we defined in the Dockerfile. The right side is the directory of our laravel project in our locale.
  "version": "0.2.0",
    "configurations": [
        {
            "name": "Listen for Xdebug",
            "type": "php",
            "request": "launch",
            "hostname":"0.0.0.0",
            "port": 9003,
            "pathMappings": {
                "/var/www/html":"${workspaceRoot}/api" //left side server that we map, right side locally worked side
            },
            "log": true
        },
Xdebug 3 Usage
After making all the above adjustments and installing our Laravel project in Docker, we press the Debug button in VSC.
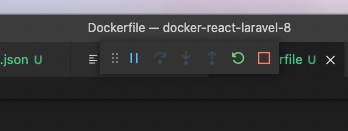
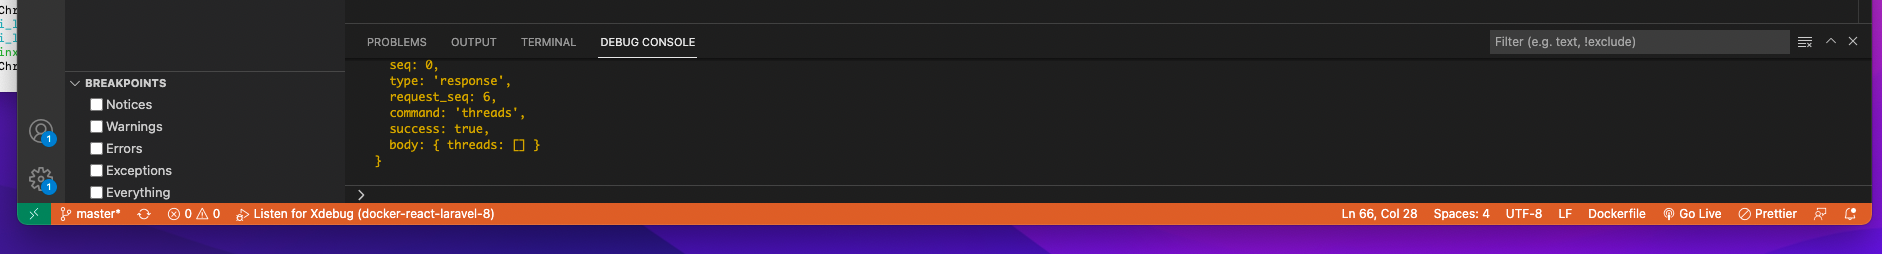
After pressing the Debug button, the bottom of the VSC editor will turn orange.
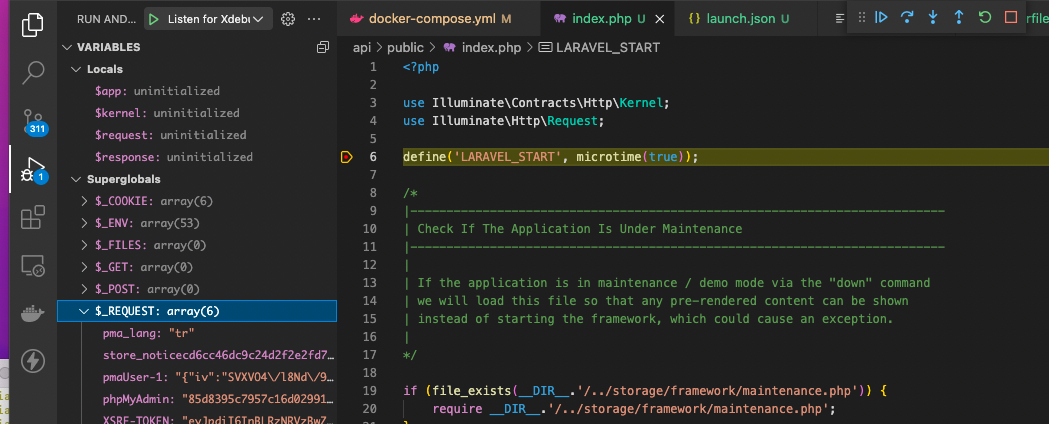
In the last step, we mark the steps that we will debug in our PHP project (for example, line 6 in the code below). When we run the relevant page of our web project, if it reaches the debug point we marked as below, the code will stop at that point. Then we can debug it by running the code step by step. On the left side of VSC, we can see the variables and their values as in the picture below.
I explained the xdebug3 installation in the simplest and most detailed way.
Good luck…